
























What is the Real Purpose of Data Visualization?
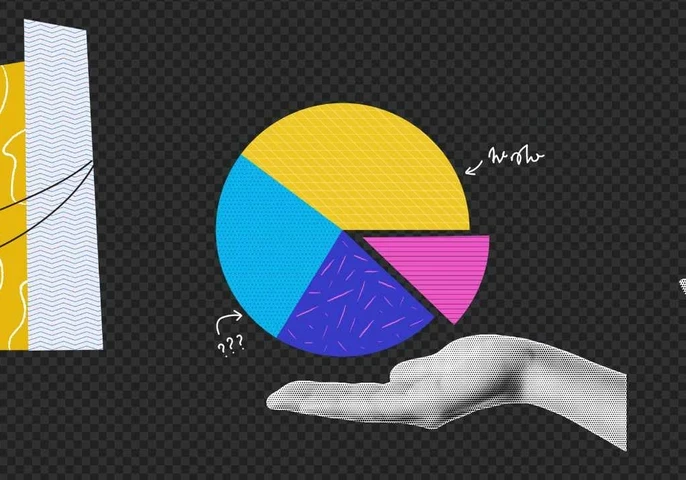
Visual hints enable immediate understanding. Therefore, converting tabulated data into histograms, pie charts, scatter plots, or color-coded geometric figures is simple yet effective for conveying complex ideas. Today’s technology also allows for 3D as well as animated dashboards to depict events. A